
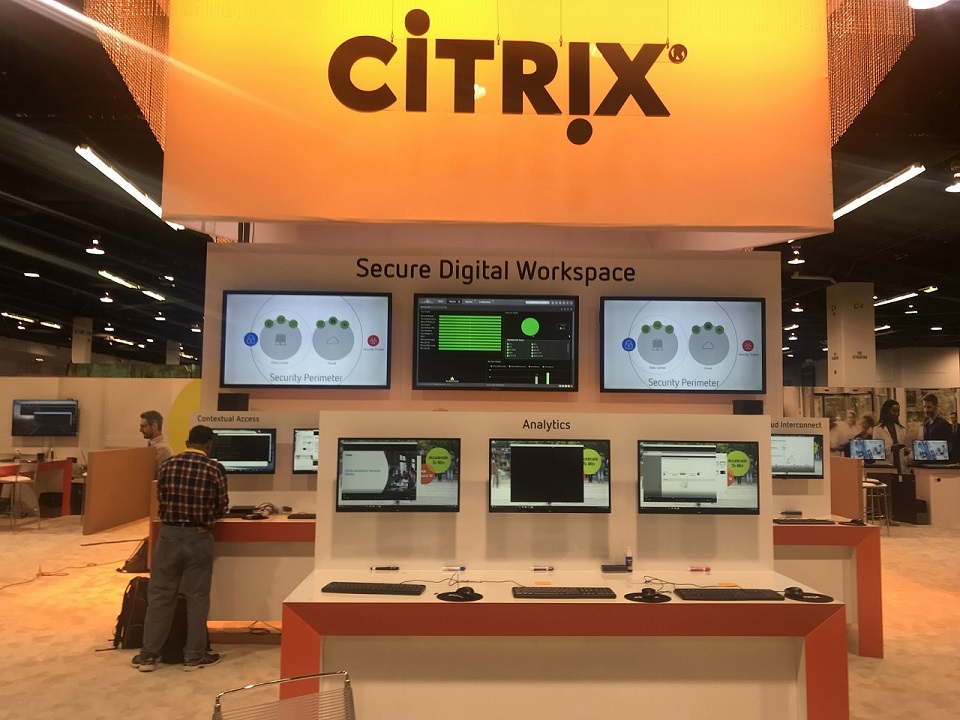
When I worked at Citrix, one of my duties was to build out and manage the network infrastructure and demo stations for the Citrix booth at events and trade shows. Citrix hosted two major events every year, Synergy and Summit, which required complex builds due to the number of demo stations and equipment needed. However, the setup was similar to networks you’d find in some organizations just on a smaller scale.
The Citrix Booth Setup
The booth included many components you’d find in a production environment: router, switches, clustered host servers, domain controllers, databases, storage and virtual desktops. The Citrix booth operated like a production environment, with uptime and performance being critical to avoid negatively impacting potential sales through poorly performing demos. Given the high stakes, I needed a monitoring solution that allowed me to track all aspects of the environment. While there are several solutions on the market, choosing one should be based on your organization’s monitoring objectives. I had four criteria for a monitoring solution:
- Provide an overall status of the environment’s health at a glance.
- Identify potential problem areas that can be proactively addressed.
- Offer accurate real-time monitoring without delays in reporting key changes.
- Deliver complete end-to-end monitoring from one console.
What Did I Monitor at Trade Shows?
The infrastructure at most trade shows was a hybrid setup, with some services running on-premises on Nutanix and Dell servers, and others running in the cloud on Microsoft Azure, Amazon AWS, and Google GCP. This setup mimicked a typical Citrix customer environment, allowing us to answer configuration questions from attendees, and provide a better demo experience. The key components I monitored included:
- Citrix Cloud connectors and appliances – ensuring connectivity to cloud resources.
- The hypervisor cluster – monitoring on-prem resources to avoid server cluster issues.
- SQL services – critical for applications using SQL databases.
- Citrix Cloud services – several services installed (detailed later).
Other important but less critical services included:
- Network switches
- Active Directory
- SCVMM server (after switching to Hyper-V due to discontinued support for Citrix Hypervisor on Nutanix)
- Citrix CVAD and StoreFront
- Microsoft Entra Connect service
My Solution of Choice
After evaluating several solutions, I chose eG Enterprise by eG Innovations, a sponsor for Synergy and Summit events and a Citrix partner. Here’s how it met my criteria:
Overall Environment Health: eG Enterprise’s Infrastructure Health view provided an at-a-glance overview, using color codes to represent health states (Red for urgent issues, Orange for potential urgent issues, Yellow for minor issues, Green for healthy, and Blue for non-reporting agents).
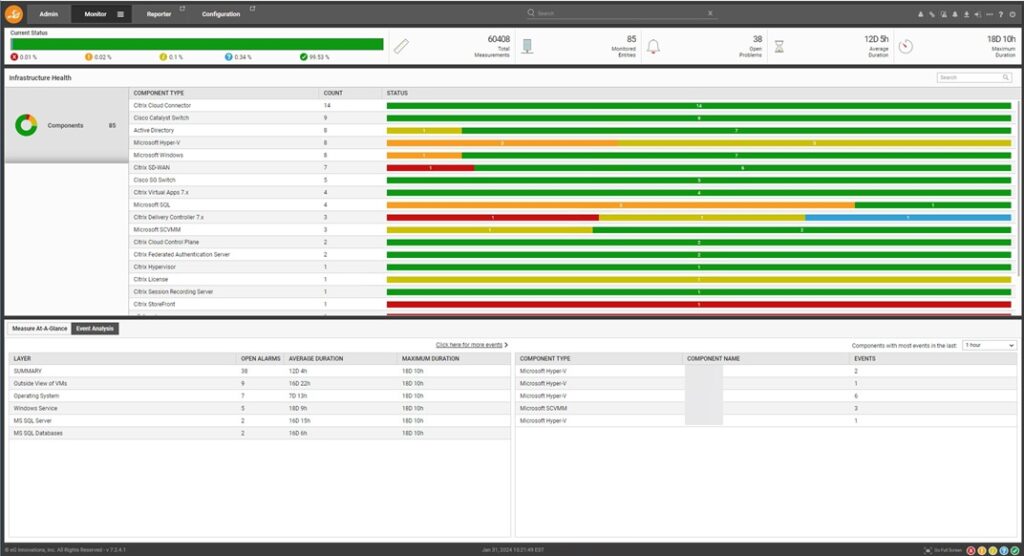
Proactive Issue Identification: The Infrastructure Health view allowed me to quickly identify and address issues, thus avoiding prolonged troubleshooting during events.
Real-Time Monitoring: eG Enterprise’s default polling interval (adjustable as needed) ensured real-time alerts for any negative status change, giving me confidence that I wouldn’t miss critical issues.
End-to-end Monitoring: Consolidating all monitoring into one console avoided the complexity of multiple solutions. While Nutanix hardware had its own console, eG Enterprise sufficed for my hardware monitoring needs, including server cluster and network switch health.
Key Monitoring Components
I listed earlier the key components I monitored for the network infrastructure. Here are a few of the specific tests in eG Enterprise that I tracked:
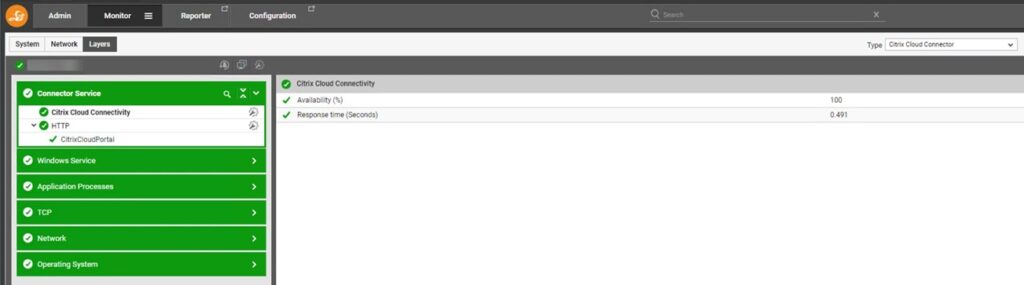
Citrix Cloud Connector
- Availability: Ensures the Citrix Cloud service is reachable.
- Response Time: Measures how long it takes for the Cloud Connector to service requests, essential during high traffic periods at trade shows.
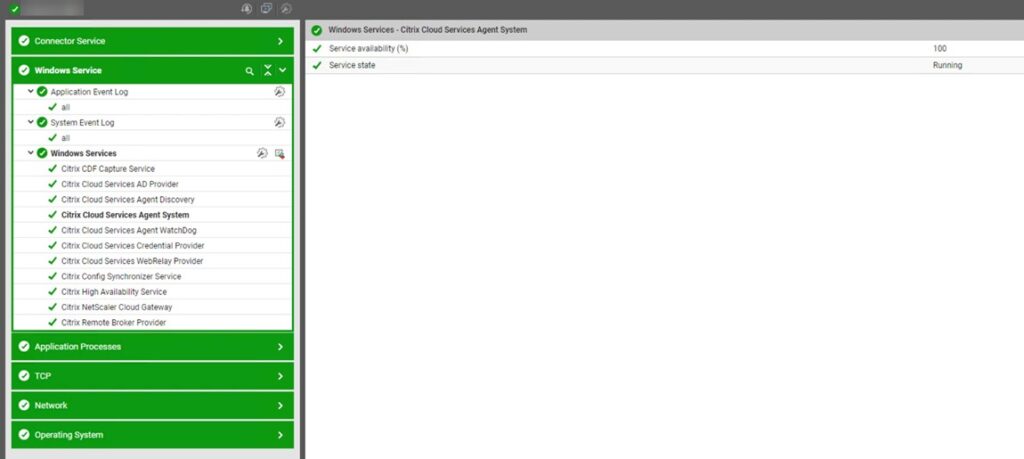
Citrix Cloud Connector Windows Services
- Citrix Cloud Services Agent System: Manages system calls for on-premises agents.
- Citrix Cloud Services AD Provider: Enables Citrix Cloud to facilitate management of resources associated with AD domain accounts in which it is enabled.
- Citrix Config Synchronizer Service: Copies brokering configuration locally so active sessions remain available when outages occur.
- Citrix High Availability Service: Maintains service continuity during an outage.
- Citrix Remote Broker Provider: Enables communication to the remote Broker Service from local VDAs and StoreFront servers.
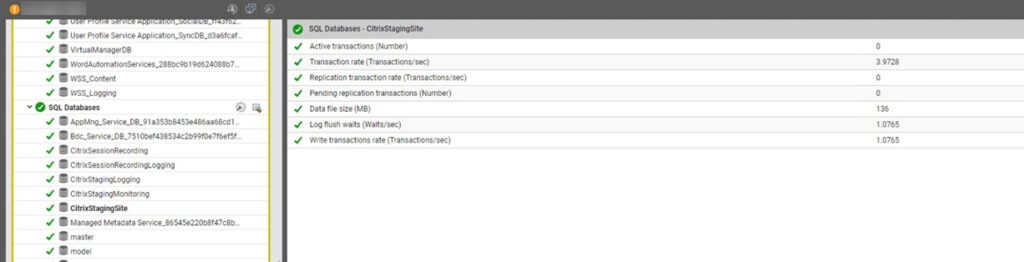
SQL Databases
Monitoring multiple databases, I tracked metrics like the number of active transactions, transaction rate, write transaction rate, and database file size. A high number of transactions or abnormal database growth was usually indicative of a problem.
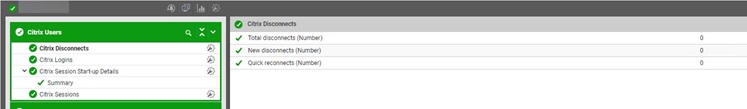
Virtual Delivery Agents
Desktop VDAs were in flux during demos and therefore did not require close monitoring. However, I monitored server VDAs closely, tracking session disconnects/reconnects, how many sessions were connected, how many sessions were idle, how many sessions were down, to identify potential server or network issues.
eG Enterprise Dashboards
Dashboards are a way to further customize eG Enterprise. Creating dashboards in eG Enterprise allowed me to track specific aspects of the environment, such as DHCP IP address allocation for the booth’s private WiFi network, ensuring there were sufficient addresses available.

I also displayed the eG Enterprise console alongside other Citrix consoles so attendees could see the Citrix technology in action, powering the booth while showing health and performance stats.
Conclusion
Along with knowing the key components to monitor in a Citrix environment, having a good monitoring solution is equally important for ensuring minimal disruption when problems do occur. That’s a peek behind the curtain at how I kept the Citrix booth infrastructure running successfully. What about you? In your environment, what are the top items you constantly monitor and look for?
The views expressed by the author do not represent those of Citrix, Cloud Software Group or eG Innovations.
Leave a Reply